In today’s data-driven world, statistics plays a crucial role in understanding and interpreting the vast amounts of information that surround us. At its core, statistics is the science of collecting, analyzing, interpreting, and presenting data. By employing statistical techniques, we gain insights into patterns, trends, and relationships within data, enabling informed decision-making in various fields ranging from business and finance to healthcare and social sciences.
To embark on our journey into the realm of statistics, it’s essential to familiarize ourselves with some fundamental concepts. Firstly, statistics encompasses a diverse range of terms and methodologies, each serving a unique purpose in data analysis. Understanding these terms, from descriptive statistics that summarize and describe data to inferential statistics that draw conclusions and make predictions, lays the groundwork for proficient statistical analysis. Moreover, recognizing the types of statistics, including descriptive, inferential, and applied statistics, provides a framework for approaching different analytical tasks.
Furthermore, our exploration of statistics begins by delving into the various sources of data and types of variables encountered in statistical analysis. Whether data is collected through experiments, surveys, observations, or existing records, it’s crucial to understand its origins and potential biases. Additionally, grasping the distinctions between different types of variables, such as categorical, numerical, discrete, and continuous variables, guides the selection of appropriate analytical techniques. As we embark on this journey through the realm of statistics, let us equip ourselves with the foundational knowledge and tools needed to navigate the complexities of data analysis effectively.
Learning Outcomes
- Define the concept of statistics and its importance in various fields of study and everyday life.
- Identify and describe key terms and terminology commonly used in statistics, such as population, sample, variable, and parameter.
- Differentiate between descriptive and inferential statistics, understanding their roles and applications.
- Classify different types of statistics based on their nature and purpose, including descriptive statistics, inferential statistics, and predictive statistics.
- Explain the significance of data sources and the importance of data collection methods in statistical analysis.
- Define the various types of variables encountered in statistical analysis, including categorical variables, numerical variables, discrete variables, and continuous variables.
- Discuss the different scales of measurement used to categorize variables, including nominal, ordinal, interval, and ratio scales.
- Identify and describe common sampling techniques used in statistical research, such as simple random sampling, stratified sampling, cluster sampling, and convenience sampling.
- Analyze the advantages and disadvantages of each sampling technique and their suitability for different research contexts.
- Understand the ethical considerations and potential biases associated with sampling methods and data collection processes.
These learning outcomes provide a comprehensive overview of the fundamental concepts and principles covered in the first chapter of an Introduction to Statistics textbook, setting the foundation for further exploration and understanding of statistical methods and techniques.
What is Statistics?
Statistics is a branch of mathematics that involves the collection, analysis, interpretation, presentation, and organization of data. It provides methods and techniques for summarizing and making inferences from data, helping us understand patterns, relationships, and variability in the world around us. At its core, statistics is about extracting meaningful insights from data to inform decision-making, solve problems, and answer questions.
Statistics in the dictionary:
- Webster’s New World Dictionary:
- facts or data of a numerical kind, assembled, classified, and tabulated so as to present significant information about a given subject.
- the science of assembling, classifying, and tabulating such facts or data.
- Meriam’s Webster Collegiate Dictionary
- a branch of mathematics dealing with the collection, analysis, interpretation, and presentation of masses of numerical data
- a collection of quantitative data
The word statistics in our everyday life means different things to different people. As a field of study, statistics is the science of
- collecting,
- organizing,
- presenting,
- analyzing, and
- interpreting numerical data,
for the purpose of assisting in making a more effective decision. The decision making process must not be based on personal opinion or on belief.
Statistics will enable you to be proficient data producers and efficient data users. It extends to almost every realm of human endeavor. Statistics is a powerful method for getting answers from data, and it is sometimes the best way to persuade others that your conclusions are correct.
Application in the Real World in Various Fields
Statistics finds applications across a wide range of fields and disciplines, playing a crucial role in understanding phenomena, making predictions, and informing policy decisions. Here are some examples of how statistics is applied in various domains:
- Business and Economics:
- Businesses use statistics to analyze market trends, forecast demand, and make strategic decisions.
- Economists use statistical methods to study factors influencing economic growth, inflation, and unemployment rates.
- Financial analysts use statistical models to assess risks, manage portfolios, and predict stock market movements.
- Healthcare and Medicine:
- Medical researchers use statistics to design clinical trials, analyze patient data, and evaluate the effectiveness of treatments.
- Epidemiologists use statistical methods to track the spread of diseases, identify risk factors, and formulate public health policies.
- Healthcare providers use statistics to assess patient outcomes, monitor disease trends, and improve healthcare delivery.
- Social Sciences:
- Sociologists use statistical techniques to study social phenomena, such as income inequality, crime rates, and voting behavior.
- Psychologists use statistics to analyze experimental data, test hypotheses, and measure psychological variables.
- Demographers use statistical methods to analyze population trends, such as birth rates, death rates, and migration patterns.
- Engineering and Technology:
- Engineers use statistics to design experiments, analyze data from quality control processes, and optimize manufacturing processes.
- Data scientists use statistical techniques to extract insights from large datasets, build predictive models, and develop machine learning algorithms.
- Environmental scientists use statistics to analyze environmental data, assess pollution levels, and monitor climate change.
- Government and Policy:
- Governments use statistics to collect census data, estimate unemployment rates, and measure economic indicators.
- Policy analysts use statistical models to evaluate the impact of policy interventions, such as tax reforms or healthcare programs.
- Urban planners use statistics to analyze transportation patterns, housing trends, and population demographics.
In each of these fields, a solid understanding of statistical concepts is essential for interpreting data accurately, making informed decisions, and addressing complex challenges. By providing clear definitions and explanations of statistical terms in our textbook, we aim to lay the foundation for students to apply statistical methods effectively in their chosen fields and contribute meaningfully to the advancement of knowledge and society.
Why we need to learn statistics?
Learning statistics is essential for several reasons:
Data Analysis:
In today’s data-rich world, being able to analyze and interpret data is crucial. Statistics provides the tools and techniques needed to make sense of large datasets, identify patterns, and draw meaningful conclusions. Whether you’re analyzing market trends, conducting scientific research, or evaluating public policy, a solid understanding of statistics enables you to extract valuable insights from data.
Informed Decision-Making:
Statistics helps us make informed decisions based on evidence rather than intuition or anecdotal evidence. By analyzing data statistically, we can assess the effectiveness of different strategies, evaluate the impact of interventions, and identify trends and patterns that may inform future actions. Whether you’re a business leader, policymaker, or researcher, statistics empowers you to make decisions that are grounded in empirical evidence.
Critical Thinking:
Studying statistics cultivates critical thinking skills by teaching students how to evaluate evidence, identify biases, and assess the validity of arguments. Statistical reasoning involves formulating hypotheses, designing experiments, and drawing conclusions based on evidence. This process fosters analytical thinking, problem-solving skills, and the ability to approach complex issues with a systematic mindset.
Communication Skills:
Statistics plays a crucial role in communicating information effectively to others. Whether you’re presenting research findings, interpreting survey results, or explaining trends to stakeholders, the ability to communicate statistical concepts clearly and accurately is essential. Learning statistics equips students with the skills needed to convey complex information in a concise and understandable manner.
Career Opportunities:
Proficiency in statistics opens up a wide range of career opportunities across various fields, including business, healthcare, government, academia, and technology. Employers value candidates who can analyze data, make data-driven decisions, and communicate findings effectively. Whether you’re pursuing a career in data analysis, research, finance, or marketing, a strong foundation in statistics can enhance your employability and advance your career prospects.
Overall, learning statistics is essential for navigating the complexities of the modern world, making informed decisions, and contributing to the advancement of knowledge and society. Whether you’re pursuing a career in a data-intensive field or simply seeking to become a more informed citizen, statistics provides the tools and concepts needed to analyze data critically, draw meaningful conclusions, and communicate findings effectively.
Types of Statistics
Statistics can be divided into two categories: Descriptive Statistics and Inferential Statistics.
Descriptive Statistics - The process of collecting, compiling, summarizing and presenting data into graphical forms such us charts, graphs, tables or numerical forms such as averages and percentages derived from them so that one can evaluate the data set easily.
Descriptive statistics include a large variety of methods for summarizing or describing a set of numbers. These methods may involve computational or graphical analysis. For example, price index numbers are one example of a descriptive statistic. The measures of central tendency and dispersion presented in this chapter are also descriptive statistics, because they describe the nature of the data collected.
Example of descriptive statistics:
- The percentage growth of Malaysia’s population from one decade to the next.
- Uses of pictorial display e.g. bar charts & pie charts.
- The average income of the 104 families in our company is RM28,673 per annum
In descriptive statistics, our objective is to describe the properties of a group of scores or data that we have “in hand,” i.e., data that are accessible to us in that we can write them down on paper or type them into a spreadsheet.
In descriptive statistics we are not interested in other data that were not gathered but might have been; that is the subject of inferential statistics.
Inferential Statistics - A decision, estimate, prediction, or generalization about a population based on a sample. It consists of methods that use sample results to help make decisions or predictions about a population.
Example of inferential statistics;
- Based on a sample survey by a lecturer at a higher learning institution, only 45% of diploma graduates further their studies in the Bachelor’s program in local IPTA.
- Department of Labor (Jabatan Buruh) uses the average income of a sample of several hundreds workers to estimate the average income of all 3 million workers, it is using a simple form of inferential statistics
- This sample of 512 families from a district indicates with 95% confidence we can conclude that the average family income in the county is between RM2518 and RM2932.
Comparison between descriptive statistics and inferential statistics
- describe the data set
- concerned with describing and summarizing a sample
|
- use the data to draw conclusions about the population
- concerned with going beyond the sample to make predictions about the population from which the sample is being drawn.
|
Population versus sample
In statistics, a population is the entire collection of all observations of interest to the researcher. It consists of all elements, individual, items or objects whose characteristics are being studied. Population can be finite or infinite.
A sample is a portion, or part or subset of the population of interest.
As an illustration, suppose we want to estimate the characteristics of a population such as the average weight of all 30-year-old men in Perlis. If from each district 100 men are selected at random, then the selected men are a sample.
Statistical terms related to population and sample.
Parameter is a numerical characteristic or measure of a population, a fixed and usually unknown quantity. For example, percentage (%) of voters, p, in Kedah who think the Government is doing a good job to control unemployment among fresh university graduates.
Census is a study of the entire population. Data is gathered on every member of the population.
Sample survey is a study on some selected portion of the population.
Statistic is a numerical characteristic of the sample data such as the mean, proportion or variance that provide estimates of the corresponding population parameters.
Element (Experimental Units) is objects (people or things) on which measurements is taken.
Pilot study is a pretest or trial run on a small number of elements (respondent) before conducting the actual survey. The objectives is to:
- To improve the questionnaires
- To identify the problems that occur during the survey
- To predict the cost, time and workforce needed.
Types (or Sources) of Data
The definition of data is the value of the characteristic of an element. We collect data due to the following reasons:
- Obtain Input to a Research Study
- Measure Performance
- Assist in Formulating Decision Alternatives
- Satisfy Curiosity
- Knowledge for the Sake of Knowledge
There are two classifications of data that is primary data and secondary data.
Primary data (or raw data)
Data gathered and collected by the researcher direct from his respondents is primary data. It is exhaustive and exclusive. Data not arranged or organized in any manner called as a set of raw data. Normally, researchers collect primary data through survey, experiment or observation.
Advantages and disadvantages of primary data
Advantages
- More accurate, reliable and up-to-date
- If the data needed by decision makers aren’t available from other sources (secondary data), primary data has to be gathered
- Primary sources usually explain how the data were gathered and what limitation exists to their use
- Usually satisfies the objectives of a research
Disadvantages
- Very costly
- Time consuming
- Requires a lot of manpower.
Secondary data
Secondary data is a primary data that has been collected, processed and published for the use of other people. There are various ways to obtain secondary data, which is through:
- Newspapers, magazines and books
- economic reports (e.g. Laporan Bank Negara)
- statistical abstract
- annual report of companies
- the Statistics department
- online sources
- and other sources
Advantages and disadvantages of secondary data
Advantages
- Require less time
- Require less effort
- Inexpensive data source
Disadvantages
- may contain errors in printing and transcription from the primary sources.
- do not know the conditions under which the data were collected and summarized.
Type of Variables
In statistics, a variable is a characteristic of interest that you measure, record, and analyze. Statisticians understand them by defining the type of information they record and their role in an experiment or study.
Performing statistical operations will depends on the nature of collected data and what type of measurements used. This is crucial to make sure that there are no violations of certain assumptions in statistical analysis and avoid drawing misleading conclusion.
Variables are measurements that can vary or expressed as more than one value during a study. Variable is also defined as the characteristic (distinguishing feature) of the elements in a population or a sample under study. Thus, variables represent the general “thing” being measured and not any specific value or code.
Examples are,
- If the DIB Course Tutor is interested in the percentage spent by his student after receiving PTPTN, the variable is amount money.
- In a study concerning the income of wage earners of all Northern Region UiTM Branch Campus graduate, the variable is income.
- If a researcher measures the weight of 30 subjects, then weight would be a variable.
- Examples of variables for humans are height, weight, number of siblings, sex, marital status and eye color.
There two types of variables: categorical and numerical.
Categorical (Qualitative) Variable:
A categorical variable is a type of variable that represents categories or groups. It doesn’t have numerical values but rather describes qualities or characteristics that can be placed into distinct groups.
- Gender: Male, Female
- Race: Malay, Chinese, Indian, etc.
- Educational Level: SPM, STPM, Diploma, Bachelor’s Degree, Master’s Degree, PhD
- Marital Status: Single, Married, Divorced, Widowed
- Type of Vehicle: Car, Truck, SUV, Motorcycle
- Categorical variables cannot be measured on a numerical scale.
- The categories are often mutually exclusive and exhaustive, meaning each observation falls into only one category, and all possible categories cover all observations.
- The order of categories is not inherently meaningful (ordinal), although sometimes they might have a natural order.
Numerical (Quantitative) Variable:
A numerical variable is a type of variable that represents measurable quantities or numerical values. It is expressed in terms of numbers and can be subjected to mathematical operations such as addition, subtraction, multiplication, and division.
- Age: 25 years, 35 years, 50 years, etc.
- Height: 160 cm, 175 cm, 185 cm, etc.
- Income: RM1,500, RM2,000, RM2,500, etc.
- Weight: 60 kg, 70 kg, 80 kg, etc.
- Temperature: 20°C, 25°C, 30°C, etc.
- Numerical variables can be measured on a numerical scale, often with meaningful intervals between values.
- They can take on a wide range of values, including decimal values.
- Numerical variables can be further classified as discrete or continuous.
- Discrete Variables:
Have distinct, separate values and typically represent counts of items. Examples include the number of children in a family or the number of cars in a parking lot.
Examples are:
- the number of students in the library
- number of cars sold by Proton weekly
- The Statistics Department collects data on household size and publishes the information in Current Population Reports.
- Continuous Variables:
Can take on any value within a certain range and can be measured with precision. Examples include height, weight, temperature, and income.
Examples are:
- distance,weights
- heights of individuals
- temperature in a room
- liters of gasoline pumped
Understanding the distinction between categorical and numerical variables is essential in statistical analysis, as it influences the choice of appropriate statistical methods and techniques for analyzing and interpreting data.
Because qualitative data always have a limited number of alternative values, such variables are also described as discrete. All qualitative data are discrete, while some numeric data are discrete and some are continuous.
Scale of Measurements
Statistics deals with measurements either quantitative or qualitative. The measurements are the actual numerical values of a variable. Variables differ in “how well” they can be measured, i.e., in how much measurable information their measurement scale can provide. Variable can be classified on the basis of their level of measurement. The way we classify variables greatly affects how we can use them in our analysis.
There are four generally used scales of measurement, listed here from weakest to strongest: nominal, ordinal, interval, and ratio.
Nominal Scale:
The nominal scale is the simplest level of measurement, where data is categorized into mutually exclusive categories with no inherent order or ranking. In other words, nominal data represent different categories or groups, but there is no quantitative significance to the values.
- Gender: Male, Female
- Eye Color: Blue, Brown, Green
- Marital Status: Single, Married, Divorced
- Blood Type: A, B, AB, O
- Categories are mutually exclusive, meaning each observation falls into only one category.
- There is no inherent order or ranking among the categories.
- Operations such as counting and mode are applicable, but arithmetic operations (e.g., addition, subtraction) are not meaningful.
Ordinal Scale:
The ordinal scale categorizes data into ordered categories or ranks, where the categories have a meaningful order, but the intervals between them are not equal. In other words, ordinal data represent a hierarchy or sequence, but the magnitude of differences between categories is not uniform.
- Educational Level: Elementary School < High School < Bachelor’s Degree < Master’s Degree < PhD
- Rating Scales: Poor < Fair < Good < Excellent
- Socioeconomic Status: Low Income < Middle Income < High Income
- Categories have a meaningful order or ranking.
- Differences between categories are not consistent or quantifiable.
- Operations such as ranking, median, and mode are applicable, but arithmetic operations are not meaningful.
Interval Scale:
The interval scale categorizes data into ordered categories with equal intervals between consecutive values, but there is no true zero point. In other words, interval data represent quantities with no meaningful zero point, and ratios between values are not meaningful.
- Temperature (in Celsius or Fahrenheit): 0°C, 10°C, 20°C, etc.
- Dates on the calendar: January 1st, February 1st, March 1st, etc.
- IQ Scores: 100, 110, 120, etc. (measured on some standardized scales)
- Categories have equal intervals between consecutive values.
- Zero point is arbitrary and does not represent absence of the attribute being measured.
- Operations such as addition, subtraction, mean, and standard deviation are applicable, but ratios are not meaningful.
Ratio Scale:
The ratio scale categorizes data into ordered categories with equal intervals between consecutive values and a true zero point. In other words, ratio data represent quantities with a meaningful zero point, and ratios between values are meaningful.
- Height: 0 cm represents absence of height, and ratios such as double or half are meaningful.
- Weight: 0 kg represents absence of weight, and ratios such as double or half are meaningful.
- Income: 0 RM represents absence of income, and ratios such as double or half are meaningful.
- Categories have equal intervals between consecutive values.
- Zero point represents absence of the attribute being measured, and ratios are meaningful.
- All arithmetic operations (addition, subtraction, multiplication, division), as well as mean, median, mode, and standard deviation, are applicable.
Understanding the scale of measurement is crucial in selecting appropriate statistical methods and techniques for analyzing data and interpreting results accurately. Each scale has its own properties and implications for statistical analysis and interpretation.
What is sampling and Why we do sampling?
Sampling is the process of selecting a subset of individuals, items, or elements from a larger population to represent that population. The subset, known as the sample, is chosen in such a way that it is expected to provide accurate and reliable information about the population from which it is drawn.
The primary objective of sampling is to make inferences or draw conclusions about a population based on observations or measurements collected from the sample. Instead of studying the entire population, which may be impractical, time-consuming, or costly, researchers select a representative sample that can provide insights into the characteristics, behaviors, or attributes of the entire population.
There are several reasons why sampling is done:
Practicality: In many cases, it is impractical or impossible to study an entire population due to logistical constraints such as time, cost, and accessibility. Sampling allows researchers to obtain valuable information about a population without the need to study every individual or item within it.
Efficiency: Sampling is often more efficient than studying an entire population. By selecting a subset of the population, researchers can save time, resources, and effort while still obtaining meaningful results.
Accuracy: When properly designed and executed, sampling can yield accurate and reliable estimates of population parameters. Statistical methods can be used to ensure that the sample is representative of the population and that the results are generalizable.
Feasibility: Some populations are too large or dispersed to study comprehensively. Sampling enables researchers to study diverse populations, including those that are geographically dispersed or difficult to access.
Risk Reduction: Sampling allows researchers to minimize the risks associated with data collection, such as respondent burden, non-response bias, and data collection errors. By selecting a representative sample, researchers can reduce the likelihood of obtaining biased or misleading results.
Generalizability: By drawing conclusions from a representative sample, researchers can make inferences about the entire population with a certain degree of confidence. This enables researchers to generalize findings from the sample to the population as a whole.
Overall, sampling is a fundamental concept in research methodology and statistics, allowing researchers to study populations efficiently, accurately, and ethically. It enables researchers to make informed decisions, generate reliable knowledge, and contribute to advancements in various fields of study.
Sampling versus Census
Sampling and census are two distinct methods used in research and data collection, each with its own characteristics, advantages, and limitations. Let’s discuss the concepts of sampling versus census:
Definition: Sampling is the process of selecting a subset of individuals, items, or elements from a larger population to represent that population. The subset, known as the sample, is chosen in such a way that it is expected to provide accurate and reliable information about the population from which it is drawn.
Purpose: The primary objective of sampling is to make inferences or draw conclusions about a population based on observations or measurements collected from the sample. Instead of studying the entire population, which may be impractical or costly, researchers select a representative sample that can provide insights into the characteristics, behaviors, or attributes of the entire population.
Method: Sampling involves the systematic selection of individuals or items from the population using various sampling techniques, such as simple random sampling, stratified sampling, cluster sampling, or convenience sampling. These techniques ensure that the sample is representative of the population and that the results are generalizable.
Advantages: Sampling is efficient, cost-effective, and practical, especially when studying large populations or when resources are limited. It allows researchers to obtain valuable information about a population without the need to study every individual or item within it.
Limitations: Sampling may introduce sampling error, which occurs when the characteristics of the sample differ from those of the population. Additionally, sampling may not capture certain population characteristics or variations, leading to potential biases in the results.
Definition: A census is a complete enumeration or survey of every individual or item in a population. Unlike sampling, which involves selecting a subset of the population, a census aims to collect data from every member of the population, leaving no individual or item unsampled.
Purpose: The primary objective of a census is to obtain comprehensive and accurate information about all members of a population. It provides a complete picture of the population’s characteristics, behaviors, or attributes, without the need for inference or estimation.
Method: Conducting a census involves reaching out to every individual or item in the population and collecting data directly from them. This may involve various data collection methods, such as face-to-face interviews, surveys, administrative records, or online forms.
Advantages: A census provides complete and accurate information about the entire population, leaving no room for sampling error or bias. It allows for detailed analysis and exploration of population characteristics, trends, and variations.
Limitations: Conducting a census can be time-consuming, resource-intensive, and costly, especially for large populations. It may also pose logistical challenges, such as reaching remote or inaccessible populations. Additionally, a census may be impractical or unnecessary for populations with millions or billions of individuals.
In summary, sampling involves selecting a subset of individuals or items from a population to represent that population, while a census involves collecting data from every member of the population. Each method has its own advantages and limitations, and the choice between sampling and census depends on factors such as the research objectives, population size, resources available, and practical considerations.
Random versus Non-Random Sampling
There are two main ways sampling method can be applied, either using random sampling or non-random sampling. Sometimes these methods is also know as probability and non-probability sampling.
Random Sampling:
Definition: Random sampling is a method of selecting a sample from a population in which every individual or item has an equal chance of being selected.
Randomness: Random sampling ensures that each member of the population has an equal probability of being chosen for the sample, making it unbiased and representative of the population.
Method: Random sampling methods include simple random sampling, systematic sampling, stratified sampling, and cluster sampling.
Advantages:
- Reduces selection bias and ensures the sample is representative of the population.
- Allows for generalization of findings to the entire population.
- Facilitates statistical analysis and estimation of population parameters.
Disadvantages:
- May be impractical or costly for large or inaccessible populations.
- Requires a complete list of population members or sampling frame, which may not always be available.
Non-Random Sampling:
Definition: Non-random sampling, also known as non-probability sampling, is a method of selecting a sample from a population in which not every individual or item has an equal chance of being selected.
Selection Bias: Non-random sampling methods may introduce selection bias, as certain individuals or items may have a higher probability of being chosen for the sample.
Methods: Non-random sampling methods include convenience sampling, purposive sampling, quota sampling, and snowball sampling.
Advantages:
- Convenient and practical for small or homogeneous populations.
- Can be useful when random sampling is impractical or costly.
- Allows for targeted sampling of specific groups or individuals of interest.
Disadvantages:
- Results may not be generalizable to the entire population.
- Introduction of bias may lead to skewed or misleading findings.
- Requires careful consideration and justification of sampling method to ensure validity and reliability of results.
In summary, random sampling aims to select a sample that is representative of the population by ensuring every individual or item has an equal chance of being chosen, while non-random sampling methods may introduce bias and may not be representative of the population. Each method has its own advantages and limitations, and the choice of sampling method depends on various factors such as research objectives, population characteristics, and available resources.
Random Sampling Techniques
There are several random sampling techniques that we can choose based on the nature of our population under study. However, within this course, we are only going to cover only 5 of them.
Simple Random Sampling:
Simple random sampling is a sampling technique where each member of the population has an equal chance of being selected for the sample. It involves selecting individuals from the population in such a way that every possible sample of a given size has an equal chance of being selected.
To perform simple random sampling, researchers typically assign a unique identifier to each member of the population and then use random selection methods, such as random number generators or random sampling software, to select the desired sample size.
Suppose we want to conduct a simple random sample of 100 students from a university population of 1000 students. Each student in the university has an equal chance of being selected for the sample, ensuring that the sample is representative of the entire population.
Illustrative Example
Sample is selected from population and has equal chance of being selected as a sample. The sample is taken randomly from a sampling frame. Some common sampling frames include the telephone directory, customer list and student list.
Researcher needs a sampling frame.
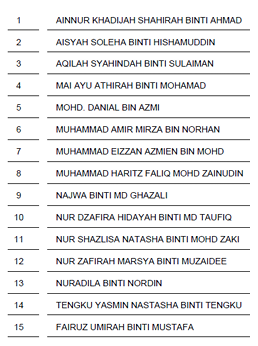
Example: List of students’ names.
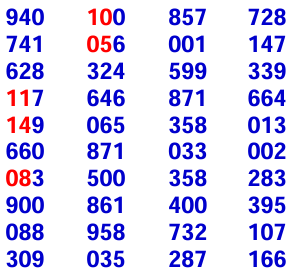
Generated random number to determine which elements are to be selected as a sample.
Use a:
1) Random numbers table
2) Computer random number generator
Steps: Type = RANDBETWEEN (1,15) in excel
It will generate random number between 1 to 15
Drag the column until you get your desire random numbers
3) Calculator Steps: Press SHIFT -> Ran# -> =
Let’s try using random numbers table, researcher needs 5 samples out of 15 students. By using the first two column numbers, list down your 5 selected samples.
Hence, the sample corresponding to 11, 14, 8, 10 and 5 will be a sample of 5 obtained from 1 to 15 elements in the population.
Systematic Sampling:
Systematic sampling is a sampling technique where a sample is drawn by selecting every kth member from a list or sequence of the population. It is a simple and efficient method that provides a representative sample when the population is large and organized in a sequential manner.
Researchers first determine the sampling interval (k) by dividing the population size by the desired sample size. Then, they randomly select a starting point within the population and select every kth member thereafter until the desired sample size is reached.
Suppose we want to conduct a systematic sample of 200 students from a university population of 2000 students. We would calculate the sampling interval (k = 2000/200 = 10) and randomly select a starting point. Then, we would select every 10th student from the list until we reach a sample size of 200.
Illustrative Example
Consider the previous illustration. In systematic sampling, we divide the population size (N) by the sample size (n) to obtain the range \((k)\)
\[k=\frac{N}{n}\]
Researcher needs a sampling frame.
Example: List of students’ names.
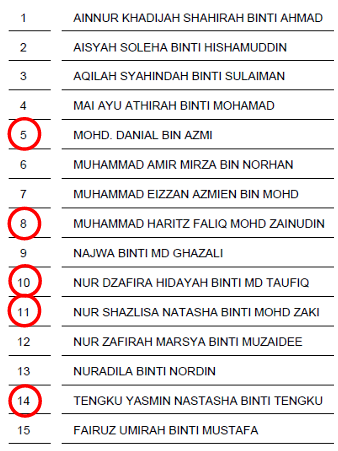
Refer to Table 1
Researcher needs 5 students (sample size, n =5) out of 15 students (population size, N=15).
\[
k = \frac{15}{5} = 3
\]
Select starting point.
Since k = 3, random number between 1 or 2 or 3 will be selected.
Type = RANDBETWEEN(1,3) and press Enter.
Let say number 2 is chosen, start with number 2 and take every k = 3.
2
2 + k = 5
5 + k = 8
8 + k = 11
11 + k = 14
Hence, the sample corresponding to 2, 5, 8, 11 and 14 will be a sample of 5 obtained from 1 to 15 elements in the population.
Stratified Sampling:
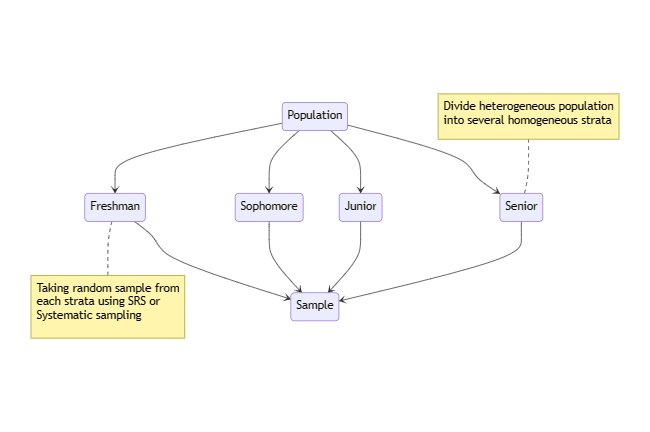
Stratified sampling is a sampling technique where the population is divided into homogeneous groups or strata based on certain characteristics (e.g., age, gender, income level), and random samples are taken from each stratum. This ensures that each stratum is represented in the sample proportionally to its size in the population.
Researchers first identify relevant stratification variables and divide the population into mutually exclusive and exhaustive strata. Then, they randomly select samples from each stratum based on predetermined proportions or sample sizes.
Suppose we want to conduct a survey on student satisfaction at a university. We may divide the student population into strata based on their academic year (e.g., freshman, sophomore, junior, senior) and then randomly select samples from each stratum to ensure representation from each year group.
Illustrative Example
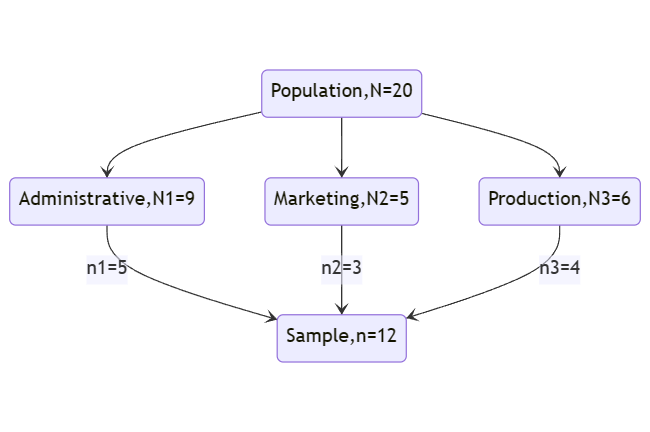
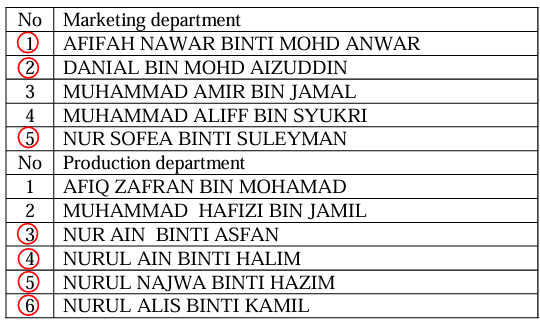
A manager is interested in studying the job satisfaction level of their staffs. There are 9 staffs in Administrative department, 5 staffs in Marketing department and 6 staffs in Production department. Only 12 staffs will be randomly selected as a sample.
Calculate required sample size, n from each strata
| Administrative |
9 |
\(n_1=\frac{9}{20}\times 12 = 5\) |
| Marketing |
5 |
\(n_2=\frac{5}{20}\times 12 = 3\) |
| Production |
6 |
\(n_3=\frac{6}{20}\times 12 = 4\) |
| Total |
20 |
12 |
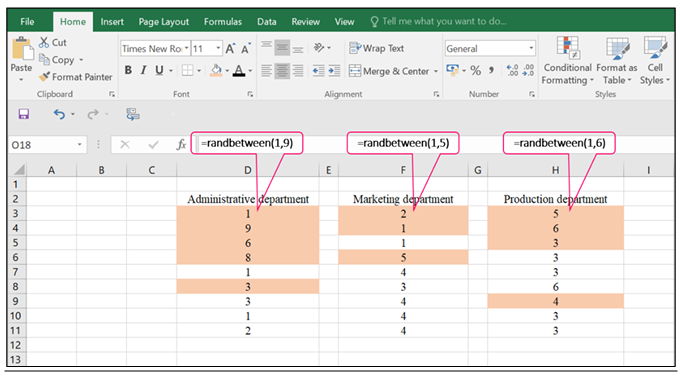
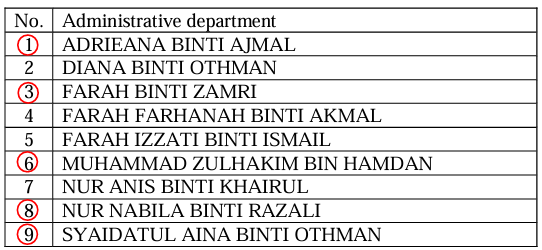
In this case, the strata were the three department. The staffs are extracted using simple random or systematic sampling from each department. Let say, use simple random sampling.
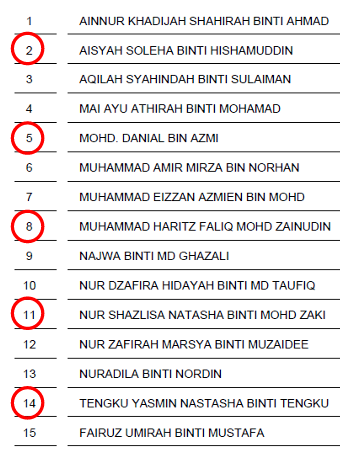
Hence, the sample corresponding to 1, 9, 6, 8 and 3 will be a sample for Administrative department. The sample corresponding to 2, 1 and 5 will be a sample for Marketing department and sample corresponding to 5, 6, 3 and 4 will be a sample for Production department.
Cluster Sampling:
Cluster sampling is a sampling technique where the population is divided into clusters or groups, and a random sample of clusters is selected for analysis. Each cluster should ideally be heterogeneous internally but homogeneous externally.
Cluster sampling is used when the population of interest is scattered widely across certain geographical area and the sampling frame is available.
Cluster sampling divides the target population into several clusters based on geographical areas.
A random sample of clusters is selected based on probability sampling technique such as simple random sampling to represent the total population. No units from non-selected clusters are included in the sample because they are represented by those from selected clusters.
With stratification, we sample from each of the subgroups but in cluster sampling, we sample from selected subgroups only.
Cluster sampling is most applicable when sampling frame is not available or incomplete.
Researchers first identify clusters within the population (e.g., geographical regions, classrooms, households) and randomly select a sample of clusters. Then, they collect data from all individuals within the selected clusters.
Suppose we want to study the performance of schools in a city. We may divide the city into school districts and randomly select a sample of districts. Then, we collect data from all schools within the selected districts.
Illustrative Example
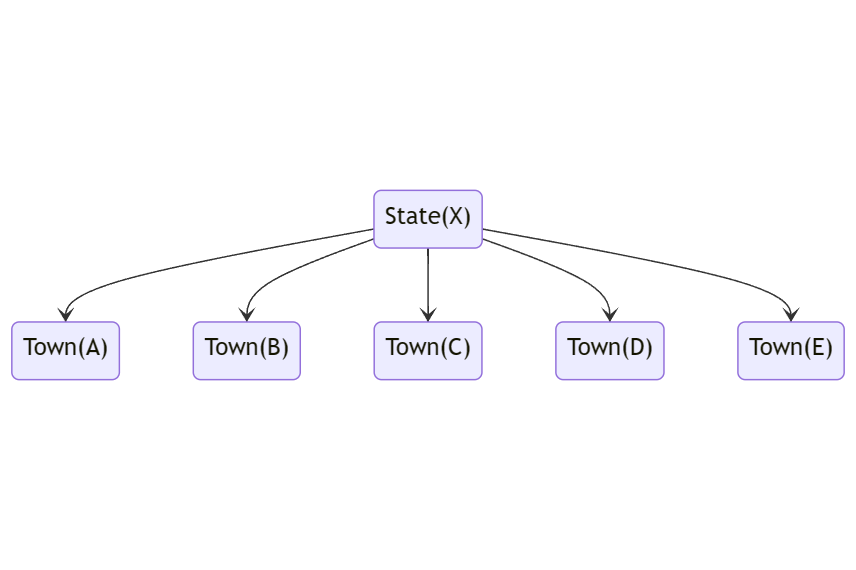
A researcher wants to take a cluster sample from a large state. The state consists of 5 towns. A random sample of 2 towns is selected.
Begin by listing all the towns with residential units. Divide the target population (state) into different clusters (town). These towns may be considered the clusters.
A random sample of clusters is selected based on probability sampling technique such as simple random sampling. Use =RANDBETWEEN(1,5) and choose 2 random number. Let say number 1 and 3 are chosen.
Then, from the selected clusters
i. Use the entire population in town 1 and 3 as sample, OR
ii. Select sample from each town1 and 3 through simple random sampling or systematic sampling.
Multi-stage Sampling:
Multi-stage sampling is a sampling technique that combines two or more sampling methods, such as stratified sampling, cluster sampling, and systematic sampling, in multiple stages. It is often used when the population is large and complex, and it allows researchers to efficiently obtain a representative sample.
Researchers first divide the population into clusters or strata and then select samples from each cluster or stratum using various sampling methods. This process may involve multiple stages of sampling, with each stage refining the sample selection process.
Suppose we want to conduct a national survey on healthcare access. We may first divide the country into regions (clusters) and then randomly select a sample of regions. Within each selected region, we may further stratify the population by demographic characteristics (e.g., age, income) and select samples from each stratum using systematic or random sampling methods.
Understanding different sampling techniques is crucial in research and data collection, as it helps researchers obtain representative samples and draw valid conclusions about the population of interest. Each sampling method has its own advantages, limitations, and applicability depending on the characteristics of the population and the research objectives.
Non-Random Sampling Techniques
Quota Sampling:
Quota sampling is a non-random sampling technique where researchers divide the population into mutually exclusive groups based on predetermined characteristics or quotas. Within each quota group, individuals are selected non-randomly until the quota for that group is filled. Quota sampling ensures that the final sample reflects the demographic or characteristic composition of the population.
Define Quotas: Researchers establish quotas based on key demographic variables, such as age, gender, ethnicity, or socioeconomic status, to ensure representation of different groups in the sample.
Identify Quota Groups: Divide the population into distinct quota groups based on the defined quotas. For example, if the quota for age groups is set at 25% for each decade (e.g., 18-29, 30-39, 40-49), ensure that each group is represented in the sample.
Non-Random Selection: Select individuals for the sample within each quota group using non-random methods, such as convenience sampling or judgemental sampling. Researchers may recruit participants based on availability, accessibility, or known characteristics.
Filling Quotas: Continuously select individuals within each quota group until the predetermined quota for that group is filled. Once the quotas for all groups are met, the sampling process is complete.
In a study on consumer preferences for a new product, researchers may set quotas based on age, gender, and income level to ensure diversity in the sample. They then recruit participants from different demographic groups until the quotas for each group are filled.
Convenience Sampling:
Convenience sampling is a non-random sampling technique where researchers select individuals who are easily accessible or convenient to recruit. Participants are often chosen based on their availability, proximity to the researcher, or willingness to participate. Convenience sampling is quick and cost-effective but may introduce bias and limit generalizability.
Identify Participants: Researchers select individuals who are readily available and accessible for participation in the study. This may include individuals in close proximity to the researcher or those who voluntarily respond to recruitment efforts.
Recruitment: Invite potential participants to take part in the study through various methods, such as in-person solicitation, social media posts, or email invitations.
Sampling: Participants who agree to participate are included in the sample without regard to their representativeness or characteristics relative to the population of interest.
A researcher conducting a survey on smartphone usage may recruit participants by approaching people in a public area, such as a shopping mall, and inviting them to complete the survey on the spot.
Judgemental Sampling:
Judgemental sampling, also known as purposive sampling, is a non-random sampling technique where researchers select participants based on their expertise, knowledge, or judgment of the population. Researchers use their judgment to identify individuals who possess the relevant characteristics or insights needed for the study. Judgemental sampling is often used in qualitative research or when specific expertise is required.
Define Criteria: Researchers establish criteria for selecting participants based on their expertise, knowledge, or relevance to the research topic.
Identify Participants: Use judgment to identify individuals who meet the established criteria and possess the desired characteristics or insights.
Recruitment: Approach selected individuals and invite them to participate in the study based on their expertise or relevance to the research topic.
In a study on effective teaching methods, researchers may purposively select experienced teachers known for their innovative instructional techniques and invite them to participate in interviews or focus groups.
Snowball Sampling:
Snowball sampling is a non-random sampling technique used to recruit participants through referrals or chain sampling. Initially, researchers identify a few individuals who meet the study criteria and ask them to refer other potential participants. The process continues iteratively, with each participant referring additional participants, creating a “snowball” effect. Snowball sampling is commonly used when the population of interest is difficult to access or identify.
Identify Initial Participants: Start by identifying a small number of initial participants who meet the study criteria or possess relevant characteristics.
Referral: Ask the initial participants to refer other individuals who meet the study criteria and may be interested in participating.
Iterative Process: Each referred participant becomes part of the sample and is asked to refer additional participants, leading to a chain reaction or “snowball” effect.
Continued Sampling: Continue the process of recruitment and referral until the desired sample size is reached or until data saturation is achieved.
In a study on the experiences of individuals living with a rare medical condition, researchers may identify a few initial participants through patient support groups or online forums and ask them to refer others in their social network who share similar experiences.
Each of these non-random sampling techniques has its own advantages and limitations. Researchers must carefully consider the appropriateness of each method based on the research objectives, characteristics of the population, and available resources. While non-random sampling techniques may offer practical advantages in terms of feasibility and efficiency, they may also introduce biases and limitations that need to be addressed in data analysis and interpretation.
Data Collection Methods
Data collection is the process of gathering the required information from our population whether we are measuring it through specific instruements or through a questionnaire (for human responses).
Personal Interview or Face-to-Face Interview Method:
Definition: Personal interviews involve direct interaction between the interviewer and the respondent. They are conducted in-person, typically at a predetermined location such as the respondent’s home, workplace, or a neutral venue. Face-to-face interviews allow for detailed questioning, clarification, and rapport building.
Process:
- Preparation: The interviewer prepares a structured, semi-structured, or unstructured interview guide with a series of questions or topics to cover during the interview.
- Scheduling: The interviewer contacts potential respondents to schedule an interview appointment at a mutually convenient time and location.
- Conducting the Interview: The interviewer conducts the interview in-person, asking questions, probing for detailed responses, and recording the answers.
- Recording Responses: Responses may be recorded manually using pen and paper or electronically using a tablet or recording device.
- Follow-up: After the interview, the interviewer may clarify responses, ask follow-up questions, or thank the respondent for their participation.
Advantages: Allows for in-depth exploration of topics, clarification of responses, and rapport building. High response rates and flexibility in probing for detailed information.
Limitations: Time-consuming and resource-intensive. May be subject to interviewer bias or social desirability bias.
Telephone Interview:
Definition: Telephone interviews involve conducting interviews over the phone. They offer a convenient and cost-effective method of data collection, especially for geographically dispersed populations or time-sensitive studies.
Process:
- Preparation: Similar to face-to-face interviews, the interviewer prepares a structured or semi-structured interview guide.
- Scheduling: The interviewer contacts potential respondents by phone to schedule interview appointments.
- Conducting the Interview: The interviewer conducts the interview over the phone, asking questions and recording responses.
- Recording Responses: Responses may be recorded manually or electronically, depending on the interviewer’s preference.
- Follow-up: After the interview, the interviewer may send a follow-up email or letter to thank the respondent for their participation.
Advantages: Cost-effective and efficient for reaching geographically dispersed populations. Allows for anonymity and may reduce social desirability bias.
Limitations: Limited rapport building and non-verbal cues. May have lower response rates compared to face-to-face interviews.
Postal or Mail Questionnaires:
Definition: Postal or mail questionnaires involve sending questionnaires to respondents via postal mail. Respondents complete the questionnaires at their convenience and return them by mail.
Process:
- Questionnaire Design: Design a clear and concise questionnaire with instructions for completion.
- Distribution: Send the questionnaires to a sample of potential respondents via postal mail, along with a cover letter explaining the purpose of the study and instructions for completion.
- Completion: Respondents complete the questionnaires at their convenience and return them by mail.
- Data Entry: Upon receiving the completed questionnaires, researchers manually enter the data into a database or spreadsheet for analysis.
Advantages: Cost-effective for large-scale surveys. Allows for anonymity and flexibility in completion.
Limitations: Low response rates. Limited ability to clarify responses or probe for detailed information. Risk of non-response bias.
Self-Administered Questionnaires:
Definition: Self-administered questionnaires are completed by respondents without the presence of an interviewer. They can be administered in-person, online, or through postal mail.
Process:
- Questionnaire Design: Design a clear and concise questionnaire with instructions for self-administration.
- Distribution: Distribute the questionnaires to potential respondents in-person, via email, or through postal mail.
- Completion: Respondents complete the questionnaires independently, following the provided instructions.
- Return or Submission: Respondents return the completed questionnaires by mail, submit them online, or return them in-person, depending on the mode of administration.
- Data Entry: Researchers collect the completed questionnaires and enter the data into a database or spreadsheet for analysis.
Advantages: Cost-effective and efficient for large-scale surveys. Allows for anonymity and flexibility in completion.
Limitations: Limited ability to clarify responses or probe for detailed information. Risk of non-response bias and incomplete responses.
Direct Observation:
Definition: Direct observation involves systematically watching and recording behavior, events, or activities as they occur in real-time. It is commonly used in observational studies, ethnographic research, and behavioral research.
Process:
- Preparation: Define the objectives of the observation and develop a structured observation protocol.
- Selection of Setting: Select a setting or environment where the behavior or events of interest are likely to occur.
- Data Collection: Systematically observe and record relevant behaviors, events, or activities as they occur, following the established protocol.
- Recording Observations: Record observations using structured observation forms, checklists, or field notes.
- Data Analysis: Analyze the collected data to identify patterns, trends, or relationships.
Advantages: Provides rich, detailed data on behavior and context. Allows for direct observation of natural behavior without relying on self-report.
Limitations: Observer bias may affect the interpretation of observations. Limited to observable behaviors or events and may not capture underlying motivations or intentions.
Each data collection method has its own advantages, limitations, and applicability depending on the research objectives, characteristics of the study population, and available resources. Researchers must carefully select and implement the most appropriate method(s) based on their specific research needs.
Questionnaire Design
Developing a good survey questionnaire is essential for collecting accurate and meaningful data. Here are comprehensive guidelines to help you create an effective survey questionnaire:
Define Your Objectives:
- Clearly outline the purpose and objectives of your survey. What information do you want to gather, and what specific research questions do you aim to answer?
Know Your Audience:
- Understand your target audience’s demographics, preferences, and characteristics. Tailor your questions and language to resonate with your audience.
Keep it Clear and Concise:
- Use clear and simple language that is easy for respondents to understand. Avoid technical jargon or ambiguous terms.
- Keep the questionnaire concise and focused. Minimize unnecessary questions to reduce respondent fatigue and increase completion rates.
Use Structured Questions:
- Use structured questions, such as multiple-choice, Likert scale, or rating scale questions, whenever possible. These types of questions provide clear response options and facilitate data analysis.
- Avoid open-ended questions unless necessary, as they can be time-consuming to analyze and may yield inconsistent responses.
Sequence Questions Thoughtfully:
- Organize questions logically and sequentially. Start with simple and non-threatening questions to ease respondents into the survey, followed by more complex or sensitive questions.
- Group related questions together to maintain coherence and flow.
Avoid Leading or Biased Questions:
- Ensure that questions are neutral and unbiased, without leading respondents to a particular response. Avoid wording that may influence respondents’ answers.
- Use balanced language and avoid making assumptions about respondents’ attitudes or behaviors.
Include Response Options:
- Provide clear and exhaustive response options for each question. Include all possible choices and ensure they cover the full range of possible responses.
- Use mutually exclusive response options to prevent ambiguity and ensure respondents can easily select their preferred choice.
Pre-test the Questionnaire:
- Conduct a pilot test or pre-test of the questionnaire with a small sample of respondents. This helps identify any ambiguities, errors, or issues with question wording, sequencing, or response options.
- Use feedback from the pre-test to revise and refine the questionnaire before administering it to the full sample.
Consider Layout and Design:
- Pay attention to the layout and design of the questionnaire. Use clear formatting, spacing, and visual elements to enhance readability and usability.
- Ensure the questionnaire is accessible and user-friendly, especially if administering it online or via mobile devices.
Ensure Ethical Considerations:
- Obtain informed consent from respondents before they begin the survey. Clearly explain the purpose of the survey, how the data will be used, and any confidentiality or privacy measures in place.
- Respect respondents’ privacy and anonymity. Avoid collecting personally identifiable information unless necessary, and assure respondents that their responses will be kept confidential.
Test for Reliability and Validity:
- Assess the reliability and validity of the questionnaire to ensure it measures what it intends to measure consistently and accurately.
- Use established methods such as test-retest reliability and content validity to evaluate the questionnaire’s effectiveness.
Review and Revise:
- Review the questionnaire thoroughly for accuracy, clarity, and coherence. Seek feedback from colleagues, experts, or stakeholders, and make revisions as needed.
- Continuously refine and improve the questionnaire based on feedback and data collected from previous surveys.
By following these comprehensive guidelines, you can develop a survey questionnaire that effectively gathers relevant and reliable data to inform your research objectives and decision-making processes.
Solved Examples
Question 1
State whether the following statements are TRUE or FALSE.
Selecting sample every \(j^{th}\) element of the population is a method of systematic sampling technique.
Nominal data is categorical data that can be ranked.
Using information of sample to make inference about population is a descriptive statistics approach.
One of the advantages of telephone survey is that respondents have more time to think of proper responses.
A list of all units in a population is called sampling frame.
Question 2
Research was conducted to examine the negative implication of online education to higher education institution undergraduate students from the educator’s perspective. The research was carried out to all universities located in the Klang Valley. There are a total of 12 universities (both public and private) listed under the Ministry of Education database. An online questionnaire was distributed through email to randomly selected respondents from all the 12 universities. Among the information recorded were the respondents age, number of years with the current university, job position (Lecturer, Senior Lecturer, Associate Professor and Professor) and highest education level (Bachelors, Masters and PhD). In addition, the respondents were asked a YES/NO response on 15 items statement related to their perceptions towards the negative implication of online education. Answer the following statements TRUE or FALSE based on the above research.
The population is all the undergraduate students at higher education institutions in Klang Valley.
The sampling frame is the list of all public and private university in Klang Valley.
The most appropriate sampling technique for the above research is stratified sampling.
Job position takes the nominal level of measurement.
All the variables mentioned above are quantitative.
Question 3
A Dean in University X doing a study to determine the opinion of students regarding Online Distance Learning. From 1200 new students register in October 2020 session, only 450 students are selected randomly as a sample. Students are listed according to their student ID. The opinion of students is scale from 1 (strongly disagree) to 5 (strongly agree).
Using this situation, answer the following questions.
Answer TRUE (T) or FALSE (F) based on the above study.
The population is all new students register for October 2020 session in University X.
The sampling frame for this study is 450 students in University X.
The level of measurement for the interest variable in the study is ratio.
The type of variable for the above study is qualitative.
The most appropriate sampling technique for the above study is systematic random sampling.
Question 4
Define the statistical terms.
a) Statistics
b) Descriptive statistics
c) Pilot study
d) Variables
e) Continuous variables
f) Population
g) Primary data
h) Probability sampling
i) Sampling error
j) Census study
Question 5
Fill in the blanks with appropriate word/statistical term.
a) Measurements or observations for a variable is called _____________ .
b) A person’s skin colour is an example of a _____________ data.
c) The collection, organizing, summarizing and presentation of data is called ______________ statistics.
d) The weight of school children is classified as _____________in the level of measurement.
e) The age of e-PJJ student is a _______________ variable.
f) A sampling frame is not needed in ____________ sampling.
g) One disadvantage of ____________as a method of data collection is the low response rate.
h) ____________ data can be obtain from other sources such as newspaper, economic journal and annual report of company.
i) A ____________ is a subset of a population.
j) A _____________ is the numerical characteristics of a population.
- Inferential
- Descriptive
- Descriptive
- inferential
- inferential
- inferential
- Descriptive
Glossary
Census: A method of collecting data from every member of the population of interest.
Data: Information collected for analysis, which can be numerical, categorical, or textual.
Descriptive Statistics: Statistical techniques used to summarize and describe the main features of a dataset.
Inferential Statistics: Statistical techniques used to draw conclusions or make predictions about a population based on a sample of data.
Parameter: A numerical summary of a population, such as a population mean or proportion.
Statistic: A numerical summary of a sample, such as a sample mean or proportion.
Sampling Techniques: Methods used to select a representative sample from a population, such as simple random sampling, stratified sampling, or cluster sampling.
Sampling Frame: A list of individuals or items from which a sample is drawn.
Sampling Error: The difference between a sample statistic and the corresponding population parameter due to random sampling variation.
Variable: Any characteristic, number, or quantity that can be measured or counted.
Scale of Measurement: The level of measurement assigned to a variable, including nominal, ordinal, interval, and ratio scales.
Bias: Systematic error or distortion introduced into sampling or testing by selecting or encouraging one outcome or answer over others.
Survey: A method of collecting data from a sample of individuals or items using questionnaires or interviews.
Pilot Study: A small-scale preliminary study conducted to test the feasibility, time, cost, and other aspects of a larger research project.
Data Collection Methods: Techniques used to gather data, including surveys, experiments, observations, and existing records.
Questionnaire Design: The process of creating effective survey instruments to collect data from respondents.